Education - Chart - online puzzles

Information Technology Services Search online puzzle
54Information Technology Services Searchsolved 22 times
Solve puzzle
Ayacuchano Altarpiece online puzzle
24Ayacuchano Altarpiecesolved 21 times
Solve puzzle
Preventing violence together Dimf online puzzle
35Preventing violence together Dimfsolved 21 times
Solve puzzle
Playful activity Gaes 1 online puzzle
30Playful activity Gaes 1solved 21 times
Solve puzzle
Teen Drugs online puzzle
35Teen Drugssolved 21 times
Solve puzzle
Methods of control online puzzle
108Methods of controlsolved 21 times
Solve puzzle
THE PEDESTRIAN STRIPES jigsaw puzzle online
84THE PEDESTRIAN STRIPESsolved 20 times
Solve puzzle
rally ,. , online puzzle
40rally ,. ,solved 20 times
Solve puzzle
Fractions jigsaw puzzle online
20Fractionssolved 20 times
Solve puzzle
Puzzle "Stakeholder needs" online puzzle
25Puzzle "Stakeholder needs"solved 20 times
Solve puzzle
Polygon jigsaw puzzle online
16Polygonsolved 19 times
Solve puzzle
COOPERATIVE LEARNING jigsaw puzzle online
45COOPERATIVE LEARNINGsolved 19 times
Solve puzzle
Figure flat jigsaw puzzle online
15Figure flatsolved 18 times
Solve puzzle
test 3 group 1 online puzzle
15test 3 group 1solved 18 times
Solve puzzle
Test results online puzzle
70Test resultssolved 18 times
Solve puzzle
Gerard June jigsaw puzzle online
42Gerard Junesolved 15 times
Solve puzzle
rotary test online puzzle
16rotary testsolved 15 times
Solve puzzle
KNOWLEDGE COLLAGE SEBASTIAN SARMIENTO THINKS jigsaw puzzle online
40KNOWLEDGE COLLAGE SEBASTIAN SARMIENTO THINKSsolved 15 times
Solve puzzle
Lithania jigsaw puzzle online
30Lithaniasolved 15 times
Solve puzzle
Puzzle - rainbow online puzzle
18Puzzle - rainbowsolved 15 times
Solve puzzle
Vitamins, Minerals and water online puzzle
30Vitamins, Minerals and watersolved 14 times
Solve puzzle
PROCESS MAP jigsaw puzzle online
72PROCESS MAPsolved 13 times
Solve puzzle
earth layers online puzzle
45earth layerssolved 13 times
Solve puzzle
Teaching and Learning Process online puzzle
63Teaching and Learning Processsolved 12 times
Solve puzzle
nigeria flag map online puzzle
4nigeria flag mapsolved 12 times
Solve puzzle
STATISTICAL GRAPHS online puzzle
48STATISTICAL GRAPHSsolved 11 times
Solve puzzle
VACCINATION jigsaw puzzle online
15VACCINATIONsolved 10 times
Solve puzzle
PUZZLES AUTOSOMIC RECCESSIVE INHERITANCE online puzzle
54PUZZLES AUTOSOMIC RECCESSIVE INHERITANCEsolved 10 times
Solve puzzle
vector and parametric equations of a line online puzzle
24vector and parametric equations of a linesolved 10 times
Solve puzzle
PERU FLAG online puzzle
4PERU FLAGsolved 10 times
Solve puzzle

Online puzzle Chart

Chart

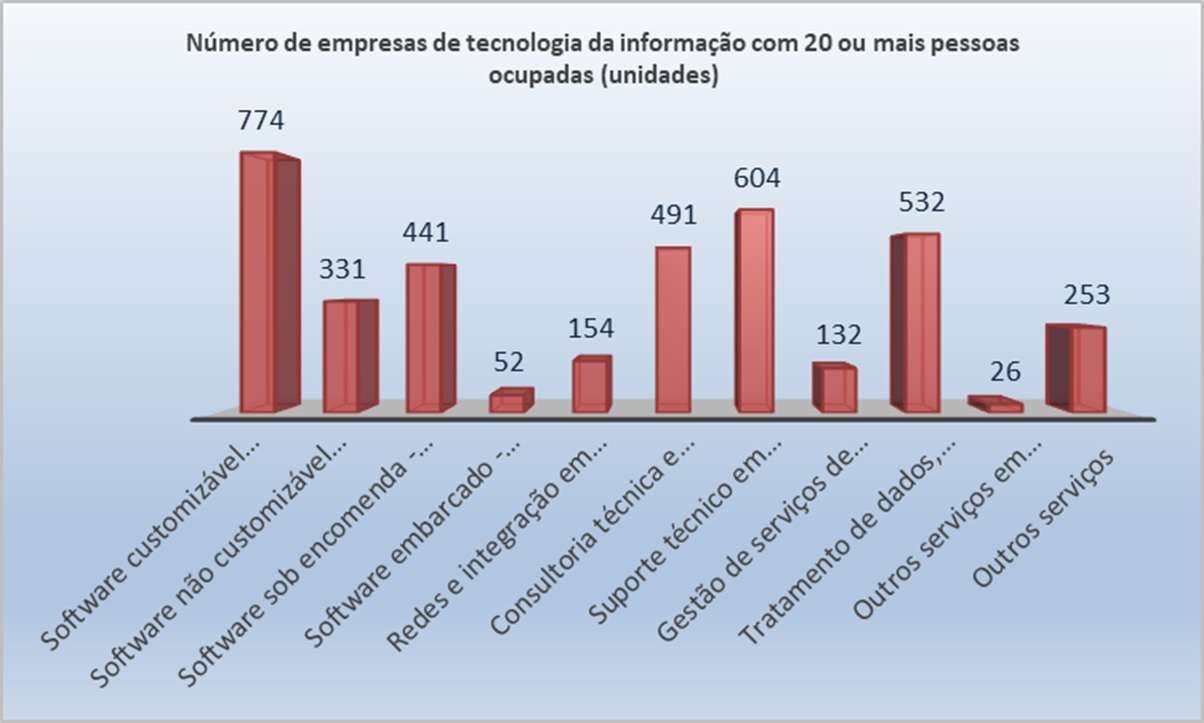
A chart (sometimes known as a graph) is a graphical representation for data visualization, in which "the data is represented by symbols, such as bars in a bar chart, lines in a line chart, or slices in a pie chart". A chart can represent tabular numeric data, functions or some kinds of quality structure and provides different info.

The term "chart" as a graphical representation of data has multiple meanings:

A data chart is a type of diagram or graph, that organizes and represents a set of numerical or qualitative data.

Maps that are adorned with extra information (map surround) for a specific purpose are often known as charts, such as a nautical chart or aeronautical chart, typically spread over several map sheets.

Other domain-specific constructs are sometimes called charts, such as the chord chart in music notation or a record chart for album popularity.Charts are often used to ease understanding of large quantities of data and the relationships between parts of the data. Charts can usually be read more quickly than the raw data. They are used in a wide variety of fields, and can be created by hand (often on graph paper) or by computer using a charting application. Certain types of charts are more useful for presenting a given data set than others. For example, data that presents percentages in different groups (such as "satisfied, not satisfied, unsure") are often displayed in a pie chart, but maybe more easily understood when presented in a horizontal bar chart. On the other hand, data that represents numbers that change over a period of time (such as "annual revenue from 1990 to 2000") might be best shown as a line chart1